1.Presenting AutoCAD Bench
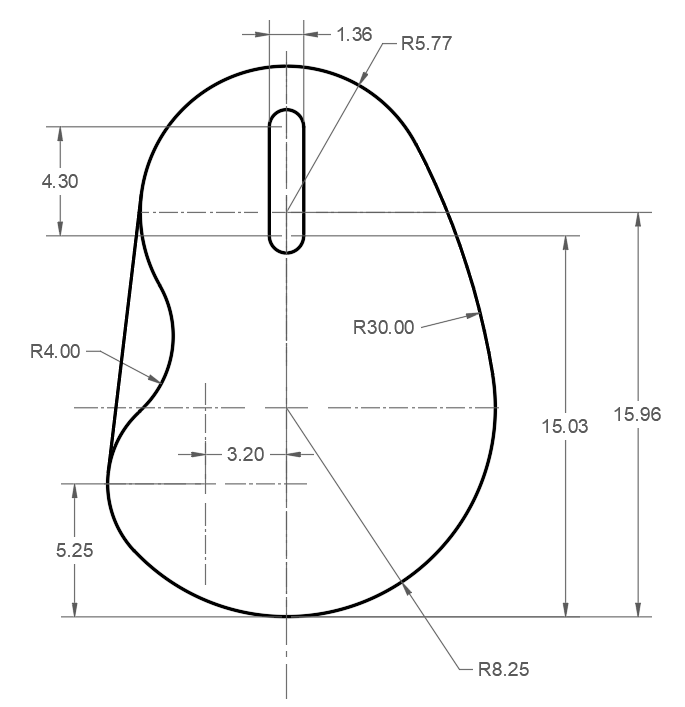
AutoCAD Bench tests whether multimodal agents can translate a dimensioned reference drawing into a correct, editable DWG. It is a fixed 50-task benchmark spanning 2D drafting and 3D reconstruction. Each agent receives a task prompt, a reference image, and a clean AutoCAD document and must work through visible mouse and keyboard actions.
2.The tasks
The benchmark covers complete 2D drafting and 3D reconstruction across four difficulty levels. It includes 21 2D and 29 3D tasks.
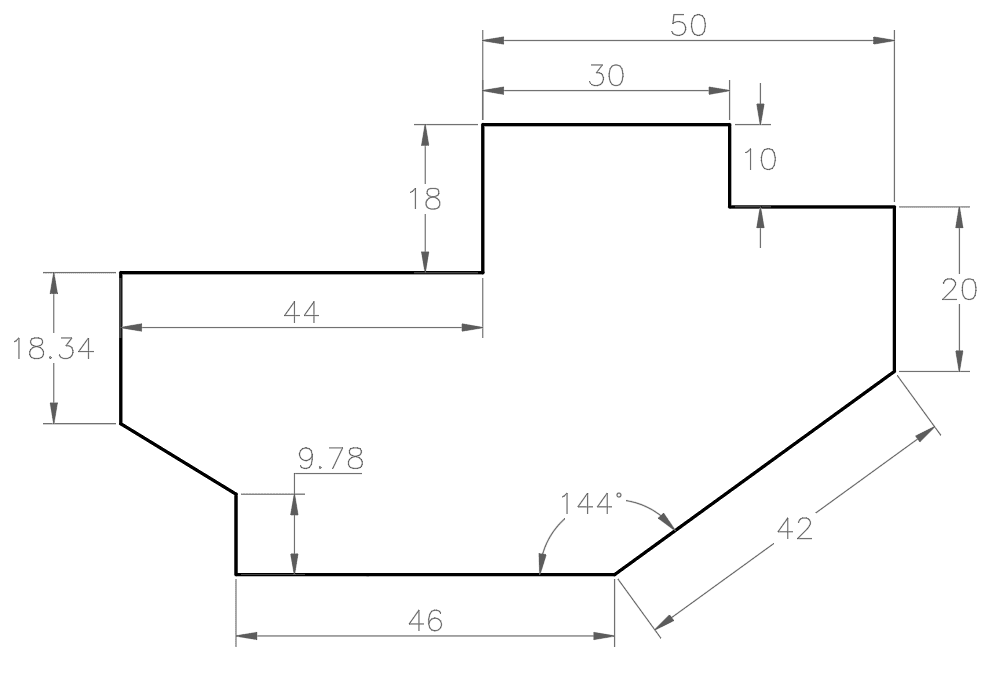
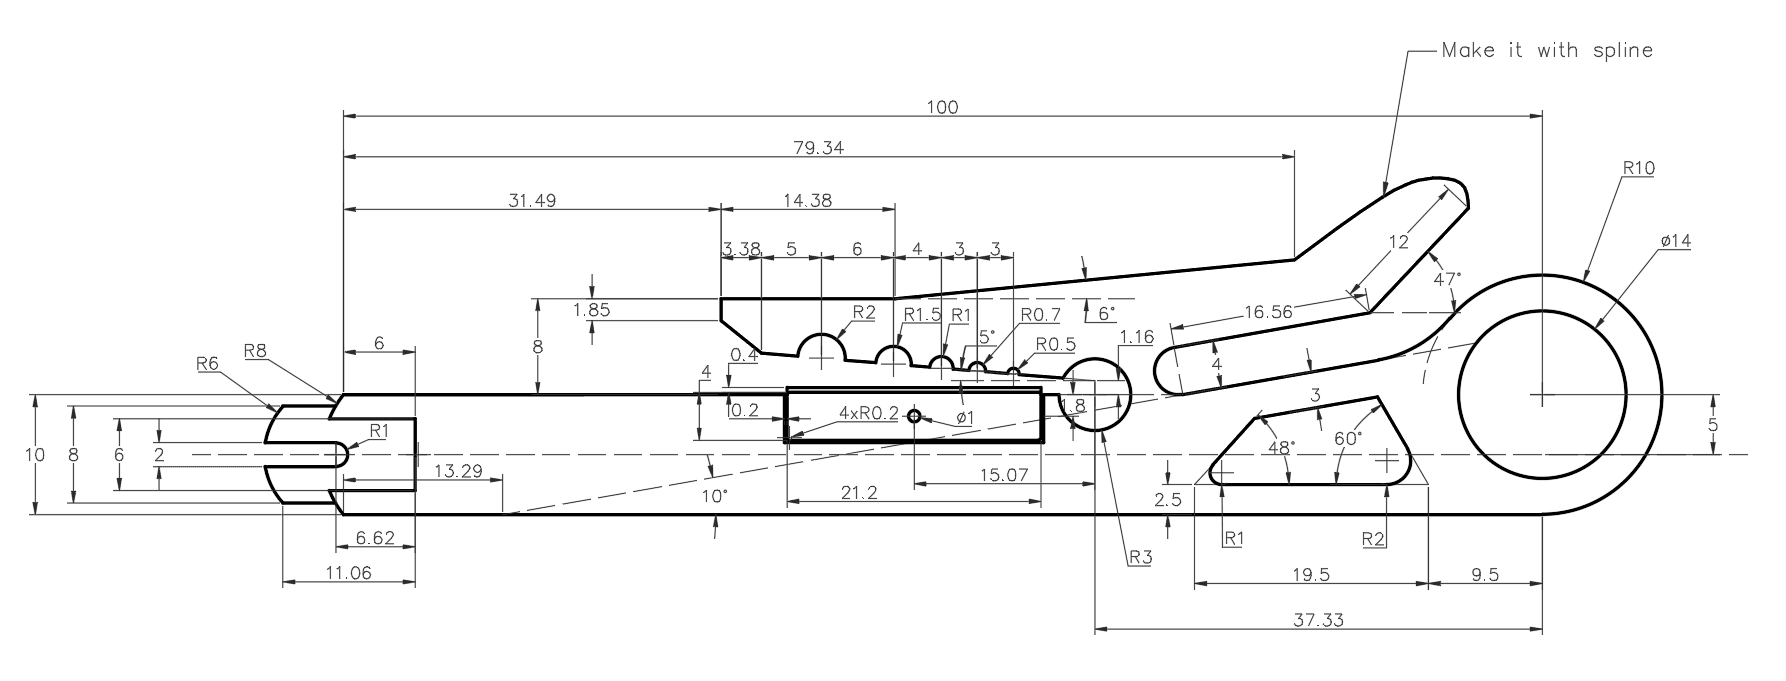
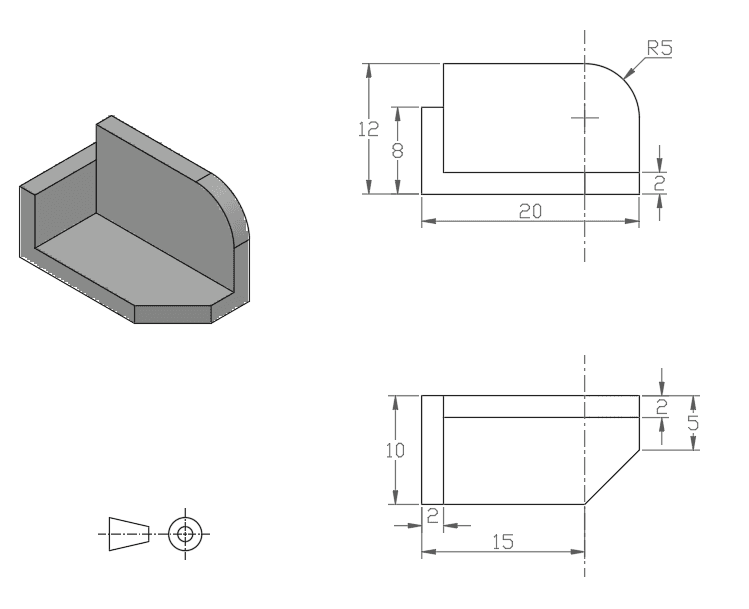
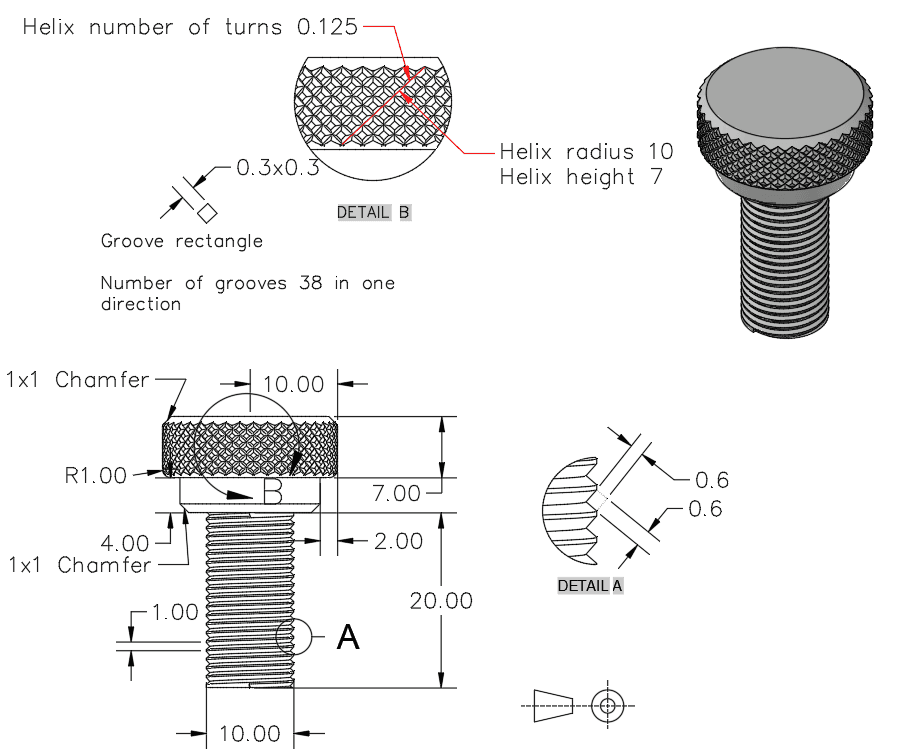
Task distribution
| Difficulty | 2D | 3D | Total |
|---|---|---|---|
| Basic | 3 | 7 | 10 |
| Intermediate | 6 | 6 | 12 |
| Advanced | 6 | 8 | 14 |
| Project | 6 | 8 | 14 |
| Total | 21 | 29 | 50 |
Expected output
2D: a complete Model Space drawing with correct geometry, dimensions, leaders, notes, center marks, and centerlines.
3D: true 3D Model Space geometry and a complete Layout1 sheet with every shown orthographic, isometric, section, and detail view and annotation.
3.The harness
Each turn observes one desktop state, emits an ordered action batch, and receives one fresh screenshot.
Task
clickdouble_clickdragmovescrollkeytypewaitdoneCurrent desktop frame
Fresh each turn
Output
Computer-use actions
01click(x, y)
02type("...")
03key("ENTER")
AutoCAD
Visible desktop
Validate
Execute
Capture frame
attempt.dwgThe loop ends when the model saves attempt.dwg and returns done.
4.The sandbox
- Software
- AutoCAD 2019 on Windows; one clean attempt.dwg is open at handoff.
- Display
- 1920 × 1080, English locale, and a fixed versioned workspace.
- Isolation
- No shell, filesystem API, AutoLISP, automation API, MCP, external files, or desktop network access.
- Artifacts
- Final DWG, screenshots, model turns, and input events are retained for audit.
5.Scoring
Only the final attempt.dwg affects correctness. A trusted AutoCAD evaluator opens the file and extracts entity, geometry, dimension, annotation, extent, 3D, layout, and viewport evidence. It also produces a normalized render.
The judge compares the reference, gold render, candidate render, and checksum-bound CAD evidence. Equivalent native constructions are accepted; wrong scale, proportions, orientation, missing features, and extra geometry are not normalized away. Its task score is the benchmark ground truth.
| Component | Weight | Measures |
|---|---|---|
| Geometry | 60% | Contours, features, scale, and proportions |
| Dimensions | 25% | Values, symbols, completeness, and association |
| Annotations | 10% | Leaders, notes, center marks, and callouts |
| Presentation | 5% | Legibility, overlap, clipping, and drafting fidelity |
raw score = 0.60 × geometry + 0.25 × dimensions + 0.10 × annotations + 0.05 × presentation
geometry gate = 35 + 0.65 × geometry
task score = min(raw score, geometry gate)
For benchmark reporting, a task counts as completed when its evaluator score is at least 75.
6.Results
Completion is the share of benchmark tasks with an evaluator score of at least 75.
01 · Overall
Task completion by model
Evaluator score ≥75 · 50 tasks
02 · Modality
2D versus 3D
2D n=21 · 3D n=29
03 · Difficulty
Where capability holds
Completion rate
04 · Trace
Example of Sol successfully completing a task
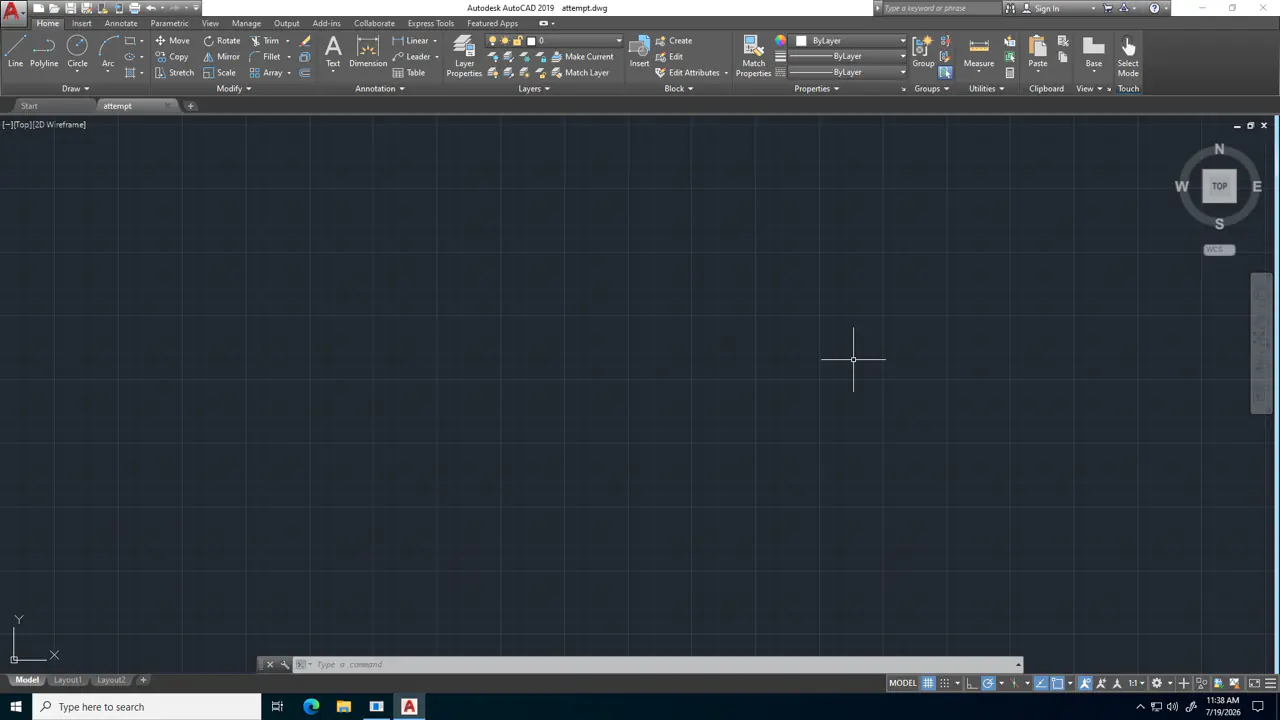
Actions emitted
Turn 1 · 1 action
- 01
click(764, 998)Focus the AutoCAD command line for precise command entry.
7.Findings
The command line became the primary interface
Models overwhelmingly drove AutoCAD through typed commands and keyboard input. Mouse use was rare, and many clicks only restored command-line focus.
typed commands or key presses
Models act in bursts, then inspect
Long command sequences were often issued from a single screenshot. This suggests strong prediction of predictable AutoCAD state transitions, while also making a batch fragile when focus or dialog state diverges.
of turns emitted multiple actions
of actions occurred inside those batches
type(ARC)key(ENTER)type(x,y)key(ENTER)FRAME t+1Average actions per model turn
The score rewards the result, not the construction
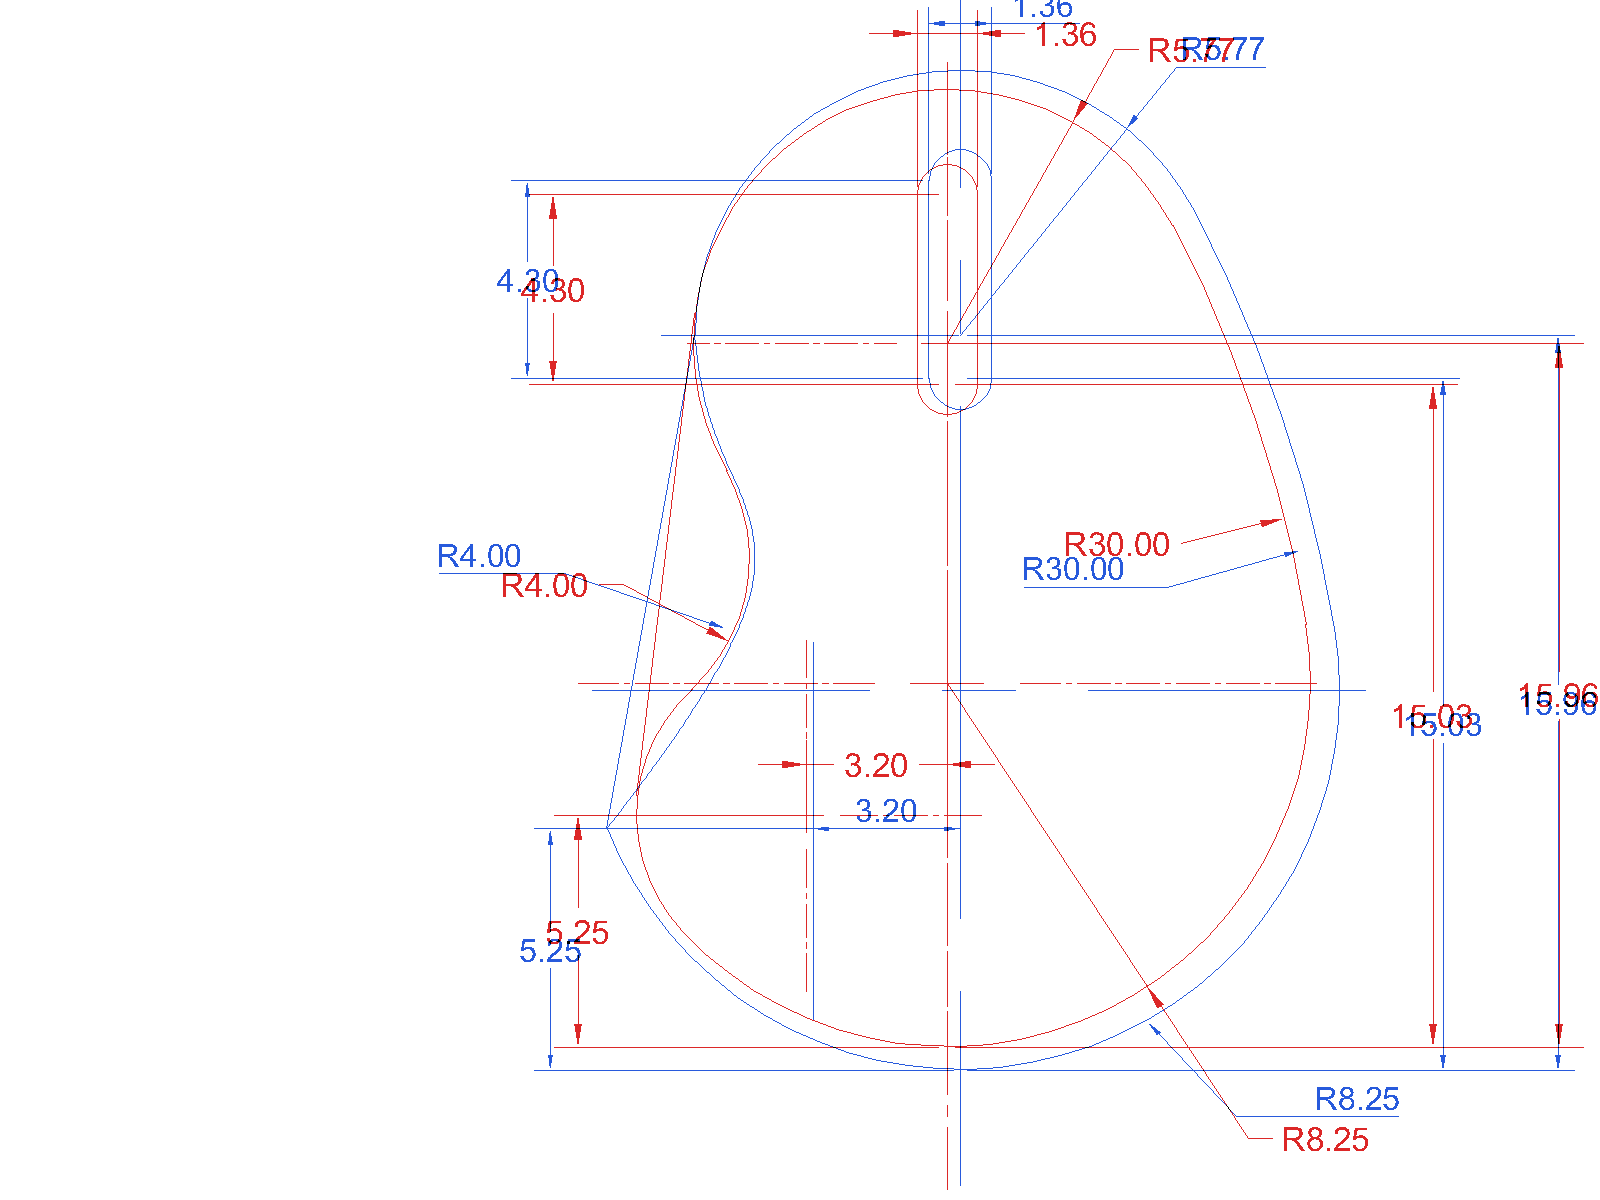
One drawback of the benchmark is that the current evaluator judges the saved output; it does not score the intermediate action trace or construction history. A visually convincing drawing can therefore hide semantically different CAD geometry.
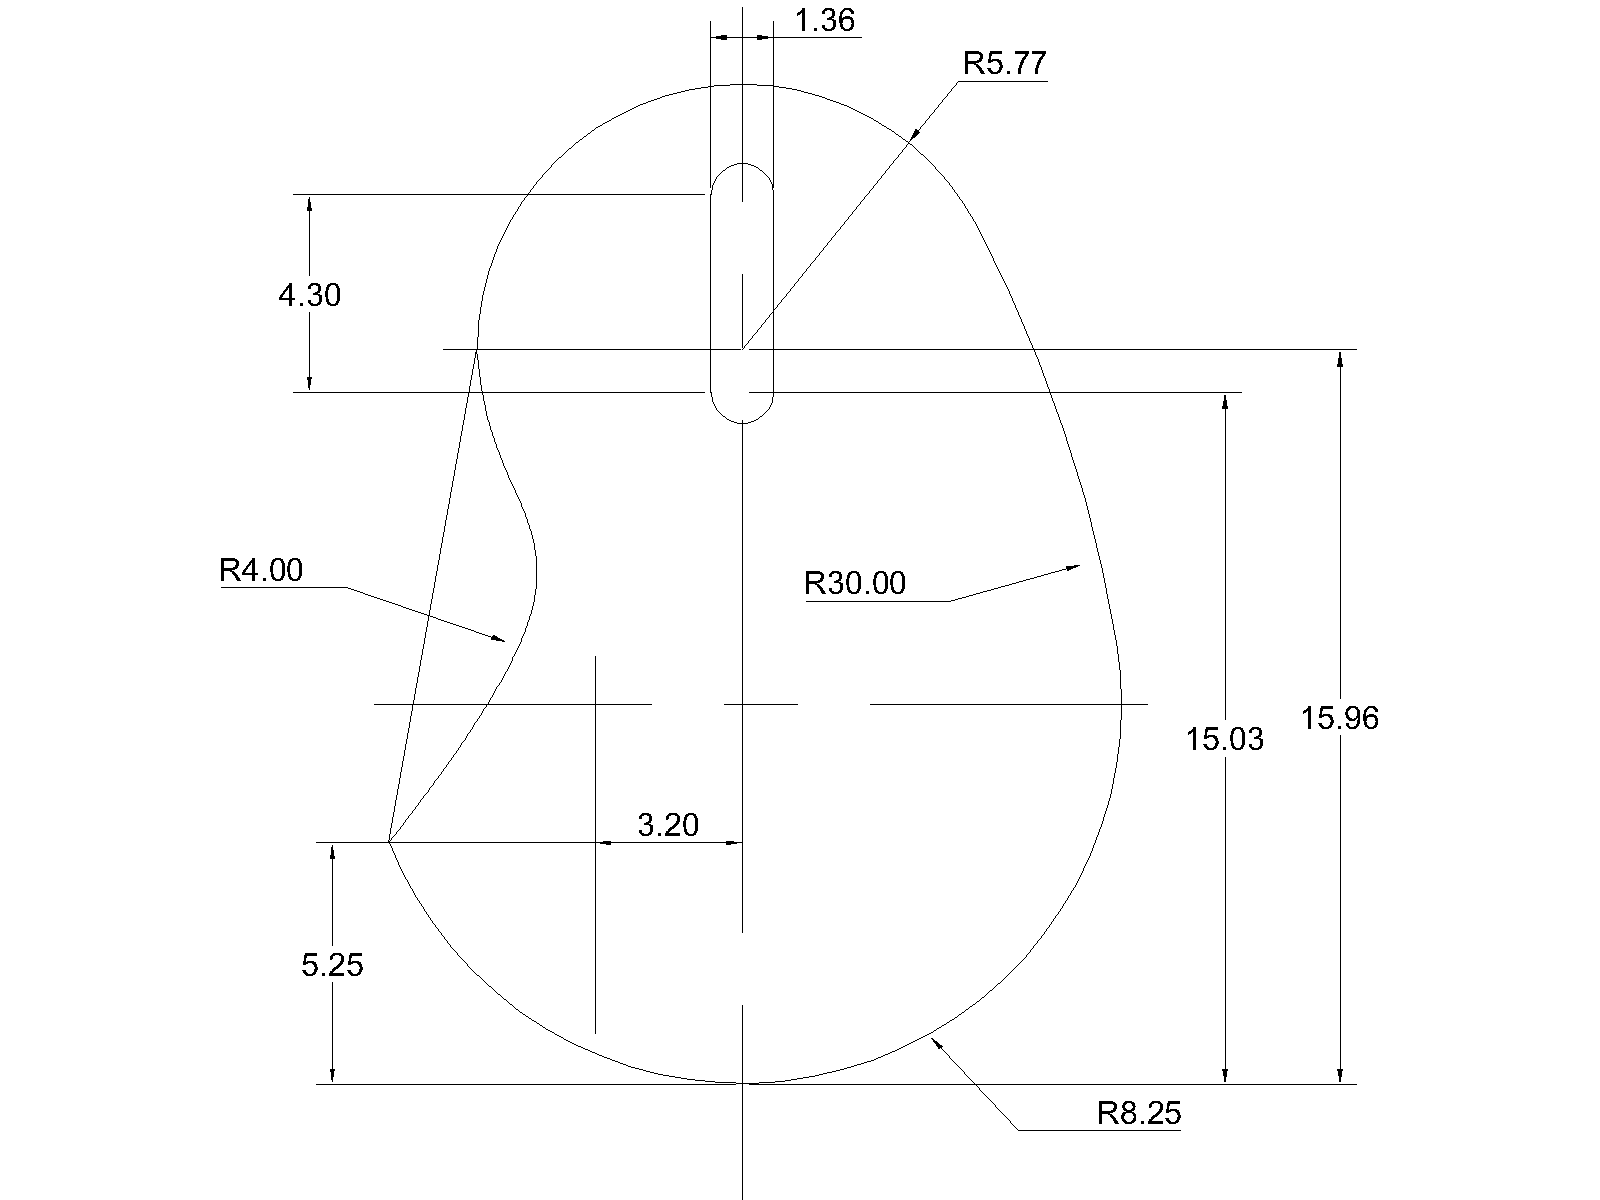
Target construction
Radius-controlled arcs
Sol construction
One S-shaped spline
Final evaluator score
86.3 / 100
In this task, Sol matched the silhouette and every displayed value, but replaced the target's radius-controlled left arcs with an unverified spline. The evaluator noticed the mismatch, yet the strong visual and dimensional match kept the score above the completion threshold.
Recognizable form was not enough
Anthropic runs often recovered the broad shape before the drafting was complete. Fable produced recognizable forms but missed exact geometry, dimensions, centerlines, annotations, and layout details. Opus performed worse: only two tasks scored above 50, and none reached 75.
8.Future Work
A stronger evaluator: pair visual scoring with entity semantics, geometric constraints, editability, and action-trace checks so visual similarity and CAD construction correctness are measured separately.
Extend the task set: the current benchmark contains only 50 tasks, which covers a fairly small distribution of real AutoCAD work. A larger, more varied set would provide a more representative measure of model capability.